
Picking up from our last discussion on glucose metabolism, this time we’re putting theory into action.
Let’s start with a chart:
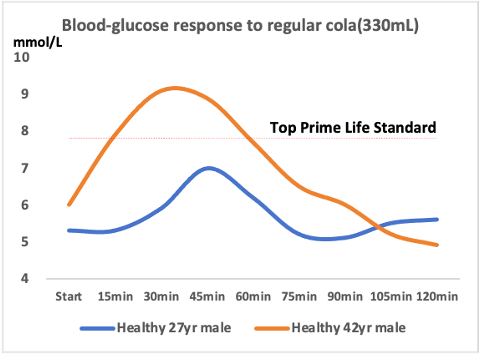
This chart comes from a series of continuous glucose monitoring (CGM) experiments conducted by Prime Lab. It shows the 120-minute blood glucose response to 330ml of classic Coca-Cola in two healthy males — one 27 years old, the other 42 (that’s me).
A can of Coke contains about 35g of free sugars. Its GI is around 65, because only half of the sugar is glucose — the rest is fructose, which doesn’t raise blood sugar directly. That’s the first clue: GI alone doesn’t tell the full story.
Despite the same drink, the two “lab mice” responded very differently. My blood glucose spiked higher and faster than the 27-year-old (peak 9.1 vs. 7 mmol/L, a 1.3x difference). Though both of our levels returned to ~5.5 mmol/L after two hours — under the normal healthy threshold of 7.8 — this experiment clearly showed how age reduces our ability to handle sugar. Insulin sensitivity drops. And the metabolic cost of a high-sugar diet increases.
This isn’t something you can feel. It’s something you can measure.
Let’s look at another chart:
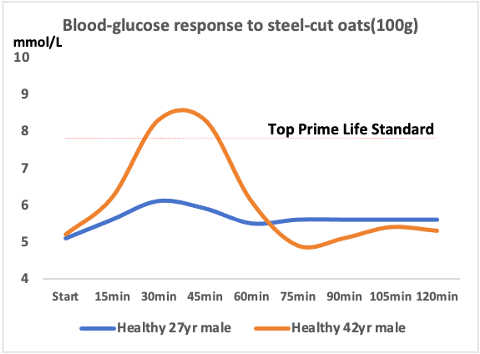
Here, we both consumed 100g of freshly cooked steel-cut oats — a “model” carb with a GI around 50, rich in fiber and beta-glucan. The younger participant had only a minor glucose rise. I, however, showed a notable spike (peak 8.3 vs. 6.1 mmol/L, a 1.36x increase). Then came the telltale crash: around 75 minutes in, my glucose dropped below his. This is a red flag for insulin resistance. The bigger the swings, the worse the control.
So today, we’re getting practical. The core questions:
- How do we avoid high-sugar diets?
- How do we eat carbs wisely?
But first, let’s reset some assumptions:
- Metabolic capacity varies dramatically between individuals.
- Generally, the older you are, the worse your glucose handling.
- GI alone isn’t enough to guide smart eating.
- What’s a “healthy carb” for one person may be a metabolic burden for another.
That’s why understanding basic concepts like GI and GL is important — but not enough.
To tailor your diet, you need quantitative feedback. That’s where CGM comes in.
1. Carbs 101
Carbohydrates are organic molecules made of carbon, hydrogen, and oxygen. They’re one of the three macronutrients (alongside fat and protein), and they include sugars, starches, and fiber.
- Monosaccharides are the simplest carbs — glucose, fructose, and galactose.
- Disaccharides pair two monosaccharides — like sucrose (glucose + fructose) or lactose (glucose + galactose).
- Polysaccharides are long chains of sugars — like starch, cellulose, and glycogen.
In practice, most carbs we eat are broken down into glucose and fructose. But these two sugars follow very different metabolic paths — which we covered in depth last time. Today, we’ll zoom in on glucose.
2. Glucose Metabolism 101
Glucose is absorbed through the small intestine into the bloodstream, raising blood sugar and triggering insulin release. The liver stores some as glycogen or converts it into triglycerides (via VLDL) for transport through the blood.
With enough insulin, glucose is taken up by muscles and fat for energy or storage. If liver glycogen is full, excess glucose gets turned into fat through de novo lipogenesis (DNL). The resulting triglycerides are shipped out via VLDL, eventually becoming LDL — the very blood lipid we try to manage.
So when we talk about how different carbs affect blood sugar, we need to talk GI and GL.
3. Glycemic Index (GI)
GI measures how fast and how high a food raises your blood sugar. Pure glucose is the benchmark (GI = 100). Other foods are scored relative to that.
Technically, GI is calculated by comparing the “area under the curve” (AUC) of a test food’s 2-hour glucose response against the AUC for the same amount of glucose.
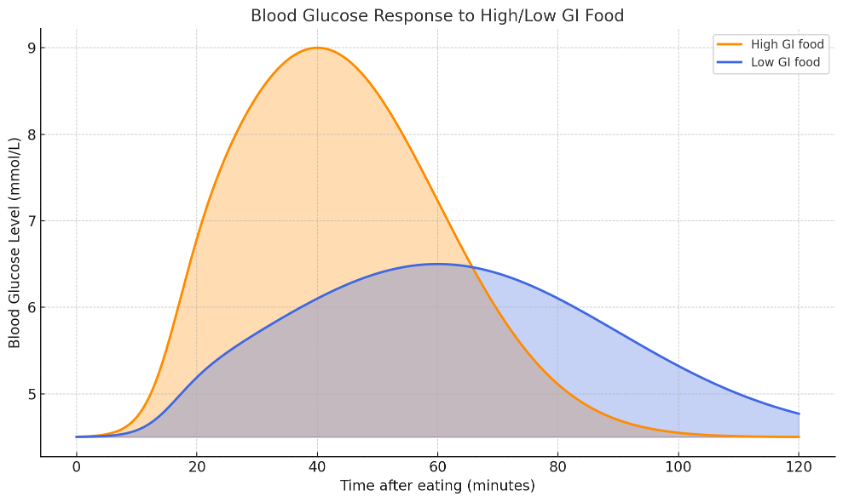
Two things drive GI: how fast glucose spikes (speed) and how high it goes (peak). The steeper and taller the curve, the higher the GI.
High-GI foods (like white bread) flood the bloodstream with glucose, forcing insulin to spike. This creates metabolic stress, burdens the pancreas, and encourages fat storage in the liver.
Consistent, low-level insulin is what we want. GI swings are the enemy.
An ideal glucose curve is flat, gentle, and quick to return to baseline — not a rollercoaster and not a plateau.
4. Glycemic Load (GL)
GI doesn’t account for how much you eat. That’s where Glycemic Load (GL) comes in:
GL = GI x Grams of carbohydrate
GL reflects the total metabolic burden — not just the speed of sugar entry, but the quantity.
A food with a moderate GI can still overload your system if you eat a lot of it.
- High GI + Large Amount = High GL (e.g., a big bowl of white rice)
- High GI + Small Amount = GL maybe okay, but large blood sugar fluctuations
- Moderate GI + Large Amount = Still might be too much
5. Practice: Using CGM to Feel the Data
CGM gives us a live readout of your glucose levels. This turns abstract knowledge into embodied understanding.
It’s the missing link between knowing and doing.
After a few cycles of CGM use (10–14 days per cycle), I learned more about my metabolism than years of lab reports ever revealed. I saw which “healthy” foods were actually stressing my system, and which combinations helped buffer the effect.
Back to the charts we began with:
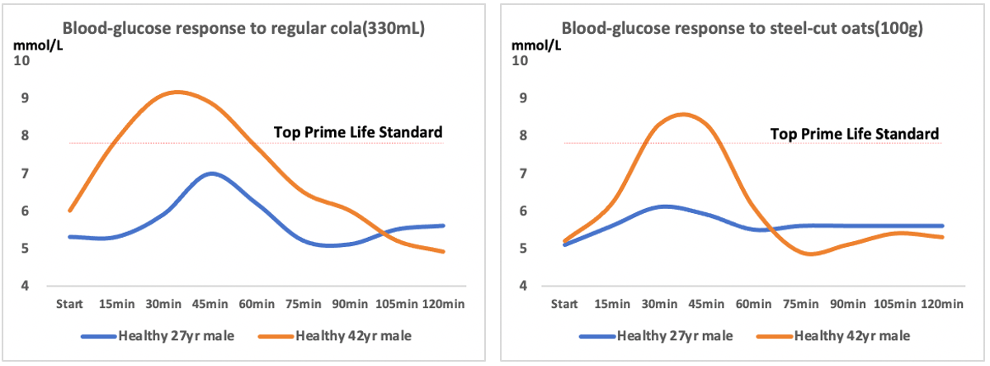
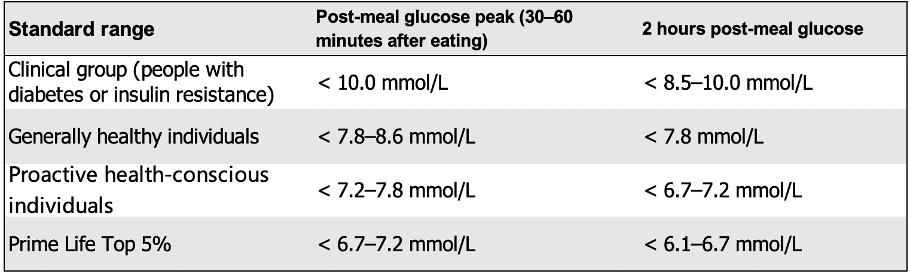
Both subjects were healthy. Standard CGM targets:
- Peak <10 mmol/L
- 2-hour postprandial <8.5–10 mmol/L 1
However, WHO guidelines for healthy individuals:
- Peak <8.6 mmol/L
- 2-hour postprandial <7.8 mmol/L 2,3
Moreover, for Prime Life practitioners, our internal benchmark is stricter:
- Peak <7.2 mmol/L
- 2-hour postprandial <6.7 mmol/L
By that measure, I need to say goodbye to classic Coke (my peak at 9.1).
Even steel-cut oats — if eaten alone — send me above 7.2. But when paired with protein, fat, and veggies, the same meal becomes metabolically manageable.
That’s a tight feedback loop: monitor, feel, intervene.
In our next entry, we’ll test a range of common foods using CGM and share actionable insights.
Quick Summary
- GI = speed of glucose rise
- GL = total load on your system
- Aim for stable, low-glucose curves
- Your personal glucose response depends on your age and metabolic health
- Prime Life targets: Peak <7.2, 2h <6.7
- CGM is a powerful tool — just 1–2 cycles can give you deep insight into your metabolic reality
Because what you can measure, you can change.
Intervention recommendations are geared toward generally healthy individuals. If you have existing health conditions, always follow your doctor’s instructions.
References4
[1] American Diabetes Association. “Glycemic Targets: Standards of Medical Care in Diabetes — 2023.” Diabetes Care, vol. 46, Supplement 1, Jan. 2023, pp. S97–S110. [2] WHO. Definition and Diagnosis of Diabetes Mellitus and Intermediate Hyperglycaemia. 2006. [3] WHO. Classification of Diabetes Mellitus and Its Complications. 1999. [4] American Diabetes Association. “Management of Diabetes in Pregnancy: Standards of Care in Diabetes — 2023.” Diabetes Care, vol. 47, Supplement 1, Jan. 2024, pp. S282–S296.